Nicholas Yang

Aspiring Data Analyst.
Nicholas has been in the sales side of business. Nicholas has always been attentive to the sales data and seeking to leverage data analytical skills to drive business solutions.
View Nicholas LinkedIn Profile
Capstone Project 3 - Nicholas Reference Insurance Company(NRIC)
![]() Project:
Nicholas Reference Insurance Company(NRIC)
Project:
Nicholas Reference Insurance Company(NRIC)
Project description:
This project focus on the insurance market in the U.S.A, where we use past market data to assist users for a better informed purchasing decision. This time round we are using Power BI for this project.
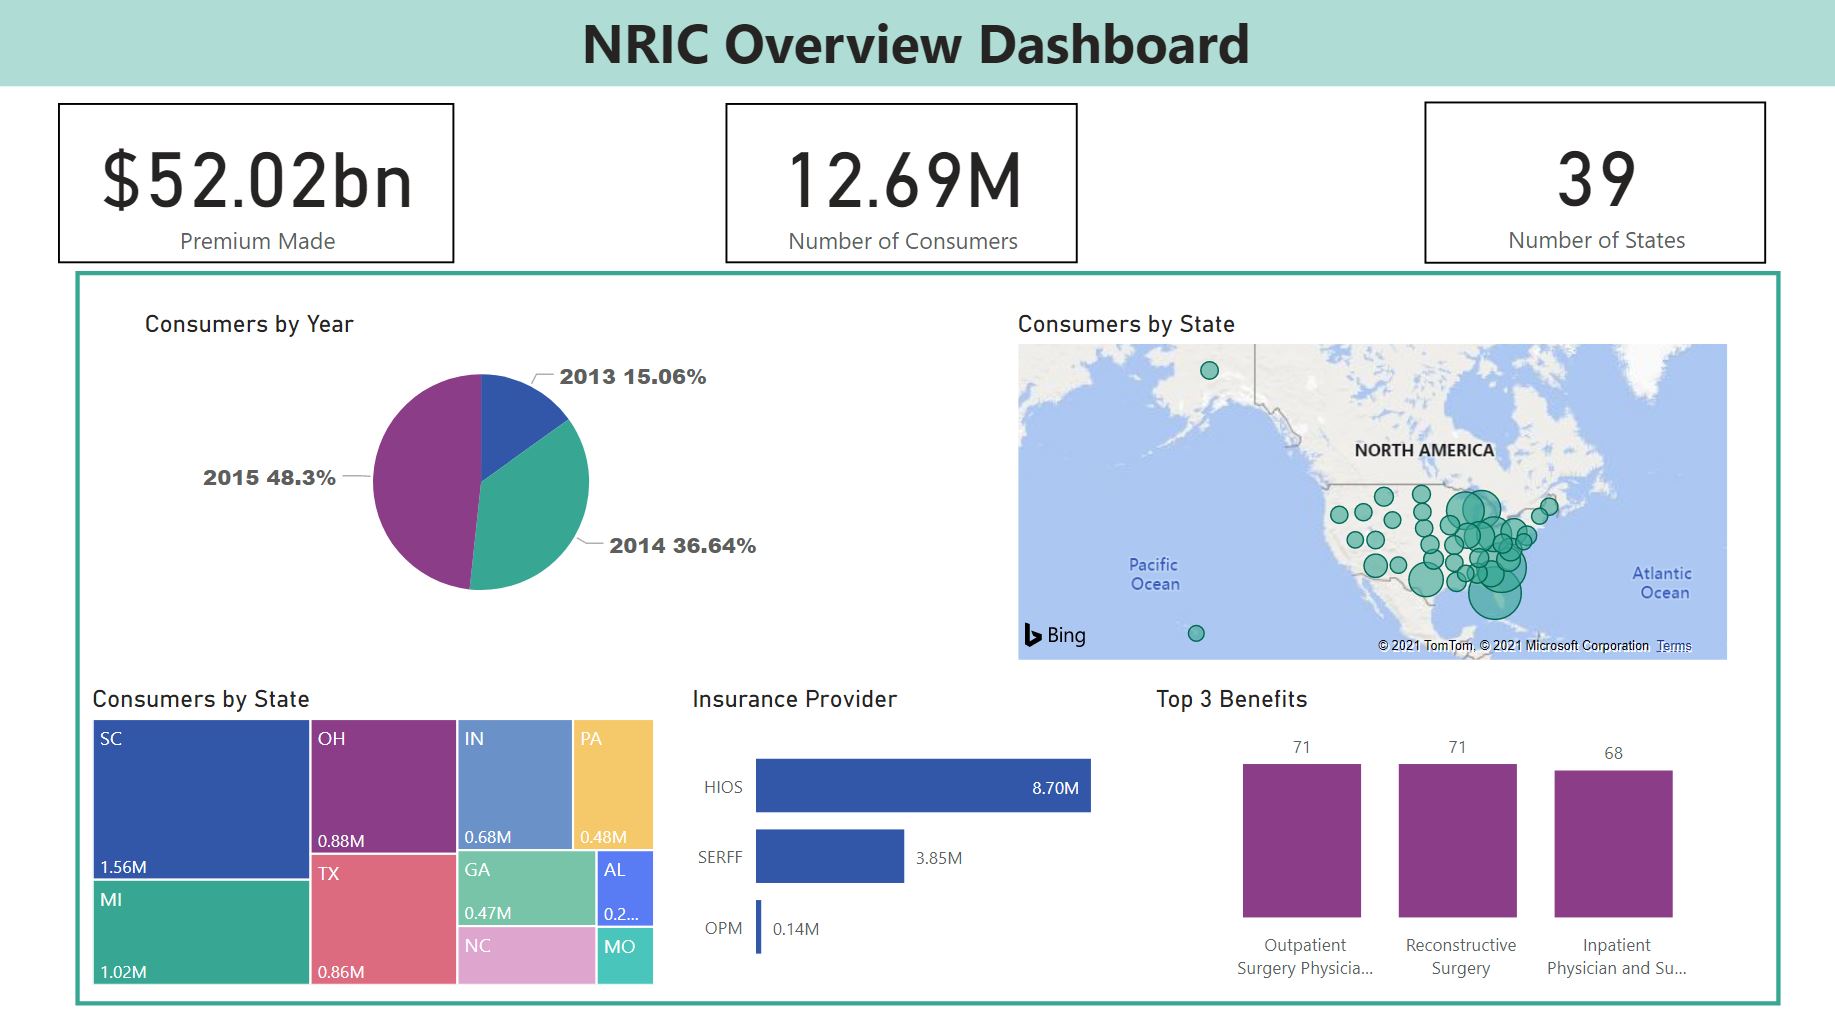
Overview of the U.S.A Insurance Market
After the cover page and introduction page, you will be looking this overview dashboard. It shows the overview numbers such as the top 3 benefits, the different insurance provider, consumers by states and many more. It gives insight to users of this dashboard to understand the current market direction and insurance benefits to focus on.
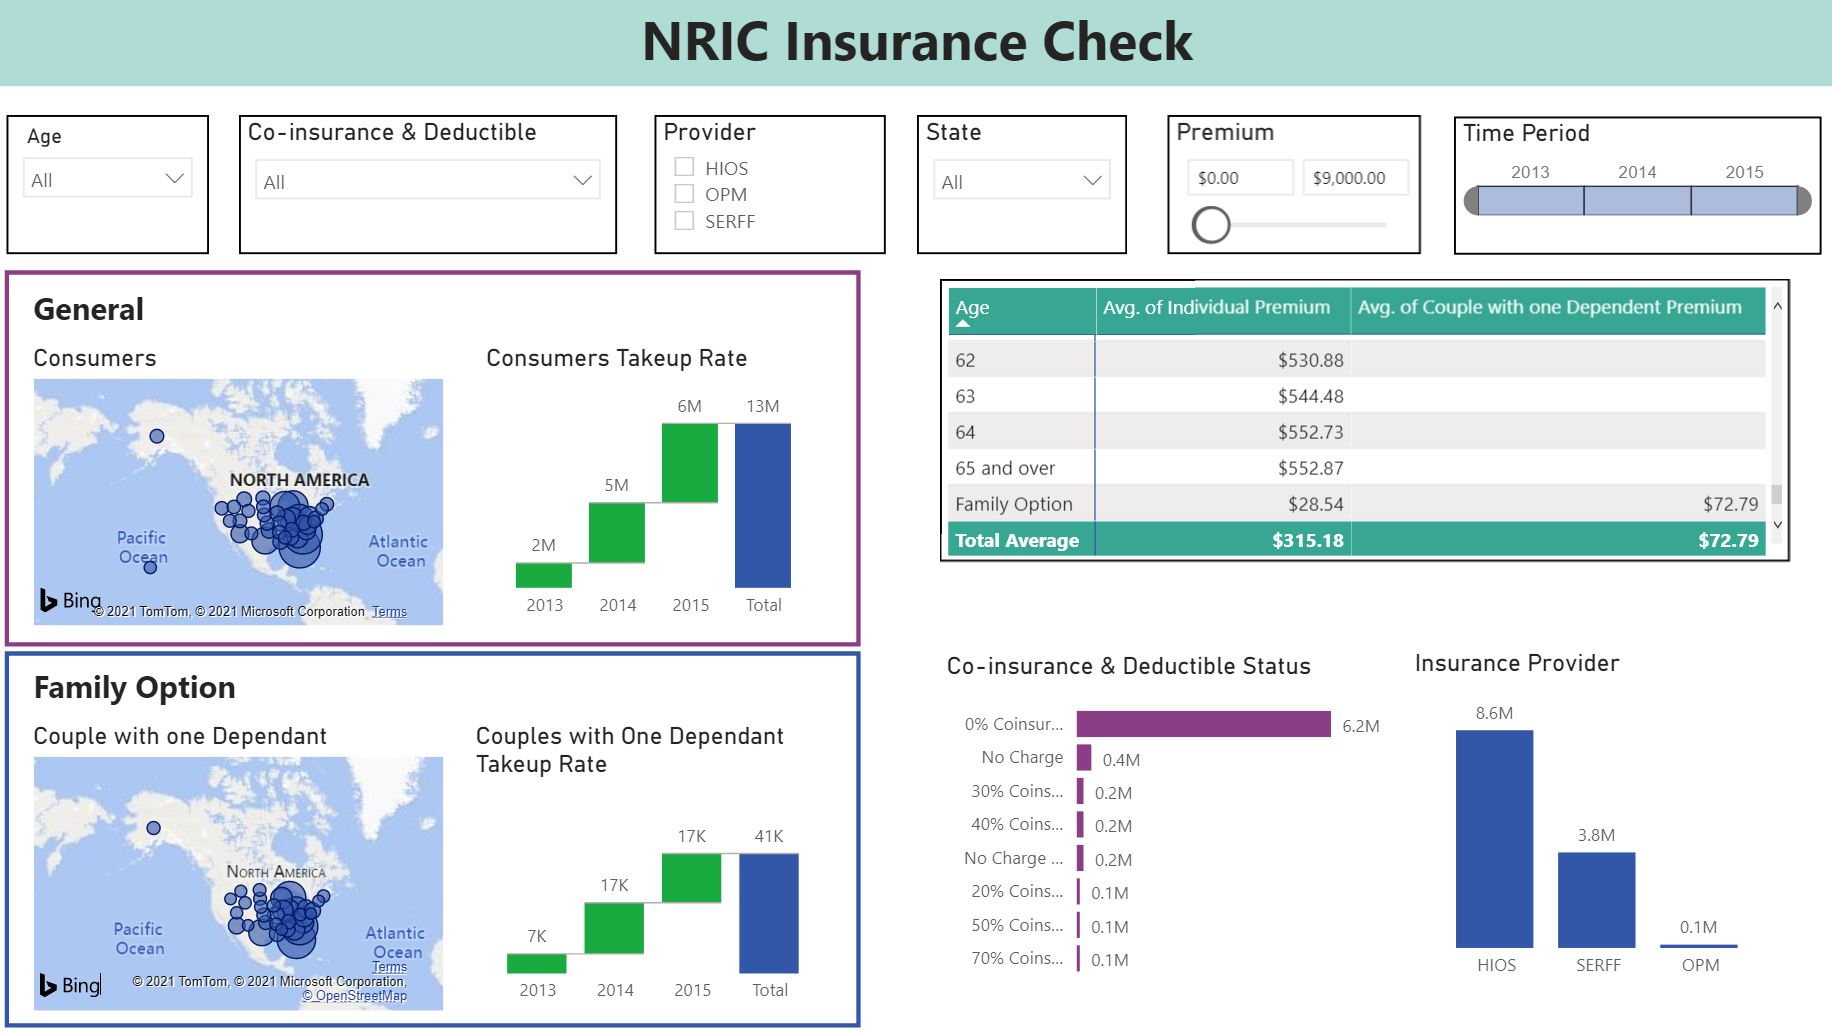
Moving on, we will be assisting a couple’s purchasing decision base on a few particulars and status of theirs. Details are in the image below.

When you are on this page, you can input your details to have a look at the insurance market situation. You can input your details such as age, co-insurance & deductible status, insurance provider, the state you are in, the premium, and the time period you are looking at.
The results will show in a few form, such as the average premium for different age group or even family option. You could also see which period of time has more people getting their insurance. You will be able to see which insurance co-insurance & deductible status and insurance provider people are getting.
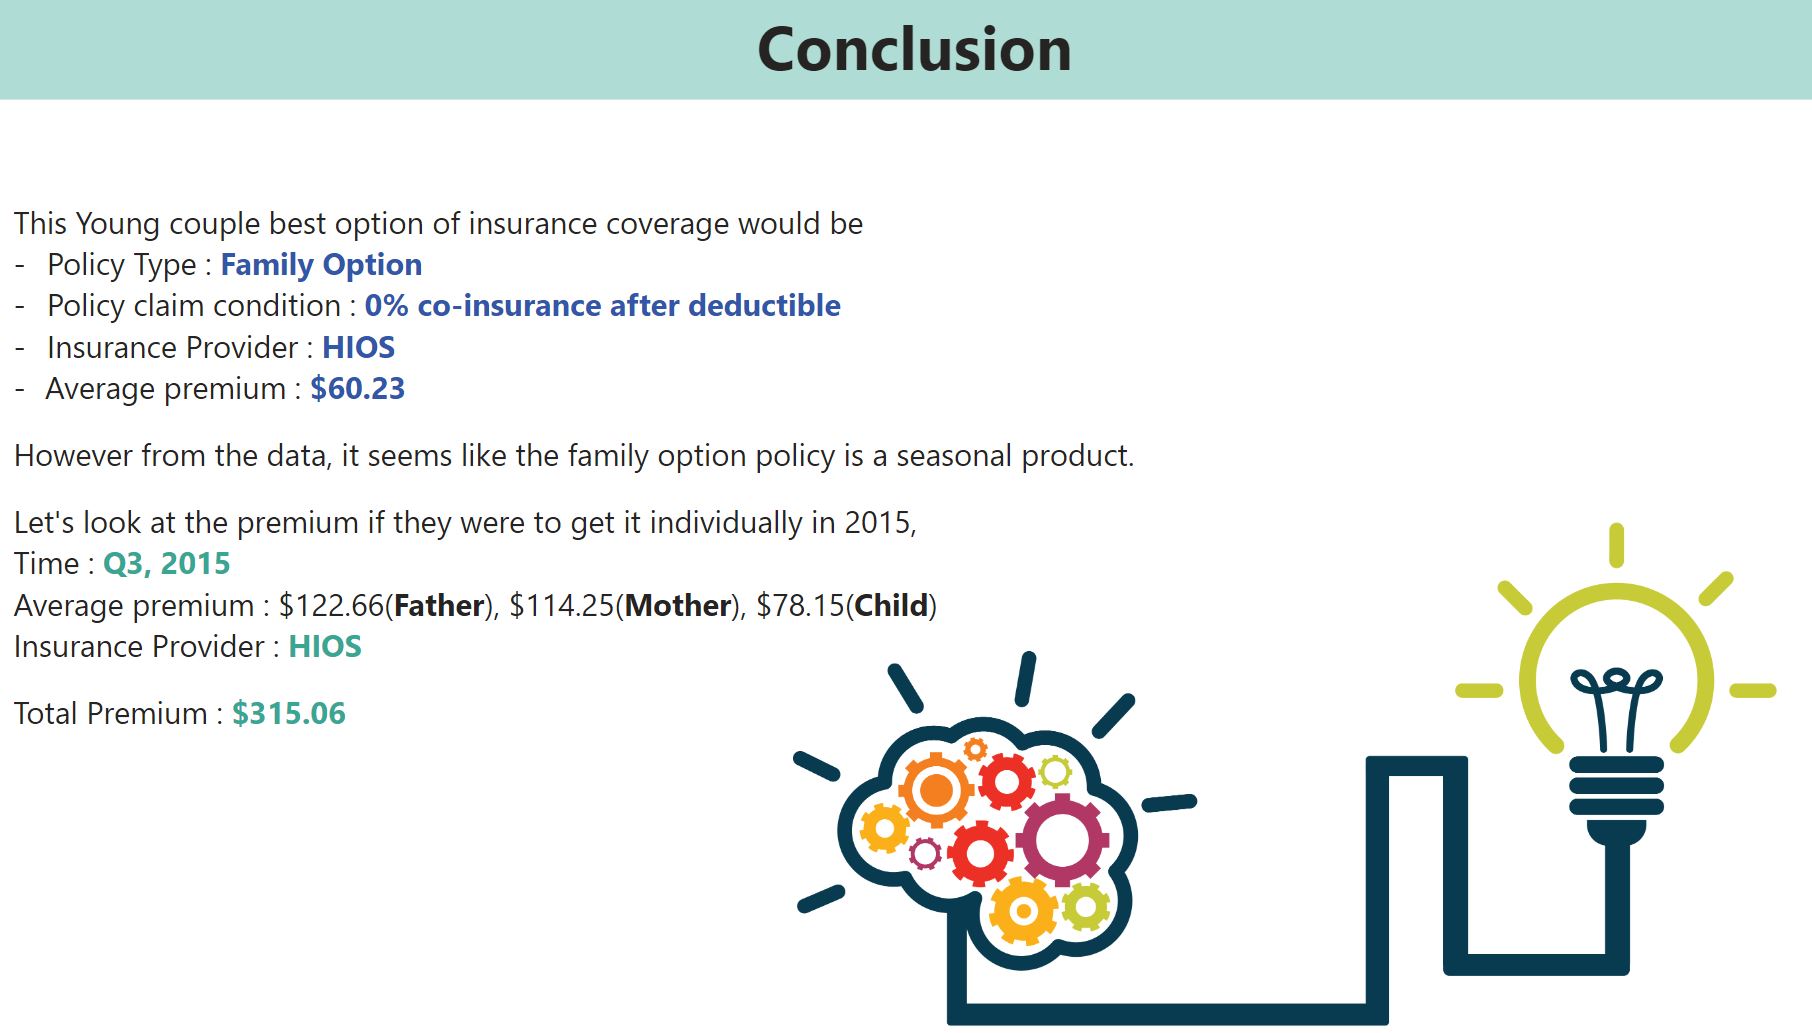
Recommendation
The recommendation for this family is to get a family option insurance from the insurance provider, HIOS. The reason being it has the lowest average premium for the family, however after analysing the data, we found out that this insurance product is a seasonal product which is not always available to them.
The alternative solution would be getting the insurance indiviudually, they can make the purchase base on the past average premium of around $315.
Conclusion
As each project goes, the data got bigger in size and it takes a longer to decipher and analyse the data. Ultimately, it boils down to what to achieve for the business objective and work towards that. Having Power BI, guide me in presenting with more useful and visual graphs that allows me to deliver the analysis better.
Please download the project at the top of the page to see more details.